![]()
This is the print version of this page. All content is copyright Indezine.com 2000-2026.
![]()
Definitions and resources for terms and techniques used in the world of presentations
See Also:
PowerPoint and Presenting Notes
PowerPoint and Presenting Glossary
Presentations Glossary in alphabetical order:
A |
B |
C |
D |
E |
F |
G |
H |
I |
J |
K |
L |
M |
N |
O |
P |
Q |
R |
S |
T |
U |
V |
W |
X |
Y |
Z
When you insert a new chart in PowerPoint, you might notice that an instance of the Excel sheet containing some dummy data for your chart pops up within PowerPoint. You then change the data within that instance of the Excel sheet to auto-update the chart on your slide. However, this Excel instance that stores your data has no separate existence. There’s no separate Excel sheet that contains your data. In fact, this Excel sheet is stored within your PowerPoint presentation itself.
To learn more, choose your version of PowerPoint. If we do not have a tutorial for your version of PowerPoint, explore the version closest to the one you use.
Edit Chart Data in PowerPoint 2016
Edit Chart Data in PowerPoint 2013
Edit Chart Data in PowerPoint 2011

Tutorial Code: 10 05 03
Previous: 10 05 02 Chart Data Table Options in PowerPoint
Next: 10 05 04 Adding and Deleting Chart Series and Categories in PowerPoint
Filed Under:
C
Tagged as: 10-05, Chart Data, Charts and Graphs, PowerPoint Tutorials
Comments Off on Chart Data: Edit Chart Data in PowerPoint
A Data Table in a chart is a tabular representation of chart data that’s placed along with the chart itself. Just adding a Data Table essentially shows the table in the default formatting, and that may work most of the time. If it doesn’t, you may want to explore some advanced options that let you format your Data Table exactly as you want.
To learn more, choose your version of PowerPoint. If we do not have a tutorial for your version of PowerPoint, explore the version closest to the one you use.
Chart Data Table Options in PowerPoint 2013
Chart Data Table Options in PowerPoint 2011

Tutorial Code: 10 05 02
Previous: 10 05 01 Chart Data Table in PowerPoint
Next: 10 05 03 Edit Chart Data in PowerPoint
Filed Under:
C
Tagged as: 10-05, Chart Data, Charts and Graphs, PowerPoint Tutorials
Comments Off on Chart Data: Chart Data Table Options in PowerPoint
There may be times when you need to show both the chart and the underlying data that created the chart. To make this possible, you can use PowerPoint’s Data Table option. This way, not only you get the pictorial representation of the values, but you also get to show the same values in the form of a table adjacent to the chart.
To learn more, choose your version of PowerPoint. If we do not have a tutorial for your version of PowerPoint, explore the version closest to the one you use.
Chart Data Table in PowerPoint 2013
Chart Data Table in PowerPoint 2011

Tutorial Code: 10 05 01
Previous: 10 04 02 More Chart Gridline Options in PowerPoint
Next: 10 05 02 Chart Data Table Options in PowerPoint
Filed Under:
C
Tagged as: 10-05, Chart Data, Charts and Graphs, PowerPoint Tutorials
Comments Off on Chart Data: Chart Data Table in PowerPoint
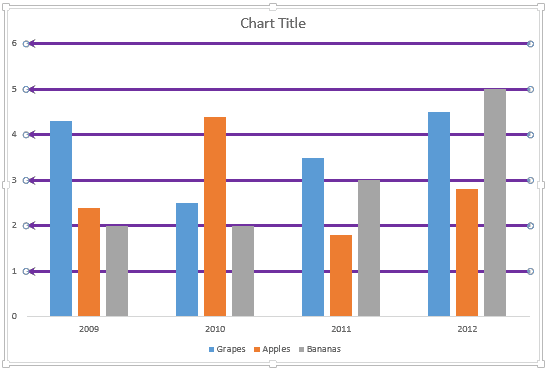
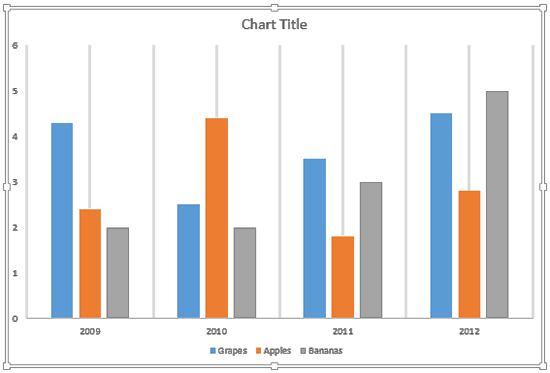
You might have noticed that by default, PowerPoint 2013 only shows Horizontal Major Gridlines on a chart. Yes, you can enable Vertical Gridlines too as we explored in our Chart Gridlines in PowerPoint tutorial, and more importantly, you can format these Gridlines to appear exactly as you want them to show.
To learn more, choose your version of PowerPoint. If we do not have a tutorial for your version of PowerPoint, explore the version closest to the one you use.
More Chart Gridline Options in PowerPoint 2013
More Chart Gridline Options in PowerPoint 2013
Tutorial Code: 10 04 02
Previous: 10 04 01 Chart Gridlines in PowerPoint
Next: 10 05 01 Chart Data Table in PowerPoint
Filed Under:
C
Tagged as: 10-04, Chart Gridlines, Charts and Graphs, PowerPoint Tutorials
Comments Off on Chart Gridlines: More Chart Gridline Options in PowerPoint
Gridlines are the lines that span wide and tall within the chart’s Plot Area. These Horizontal and Vertical gridlines originate from the axes, which makes the data easier to comprehend for the viewer. Gridlines may emerge from both the horizontal and vertical axes, although by default you can see only Horizontal gridlines on the chart.
To learn more, choose your version of PowerPoint. If we do not have a tutorial for your version of PowerPoint, explore the version closest to the one you use.
Chart Gridlines in PowerPoint 2013
Chart Gridlines in PowerPoint 2011
Tutorial Code: 10 04 01
Previous: 10 03 07 Apply Pattern Fills to Plot Area of Charts in PowerPoint
Next: 10 04 02 More Chart Gridline Options in PowerPoint
Filed Under:
C
Tagged as: 10-04, Chart Gridlines, Charts and Graphs, PowerPoint Tutorials
Comments Off on Chart Gridlines: Chart Gridlines in PowerPoint
Microsoft and the Office logo are trademarks or registered trademarks of Microsoft Corporation in the United States and/or other countries.