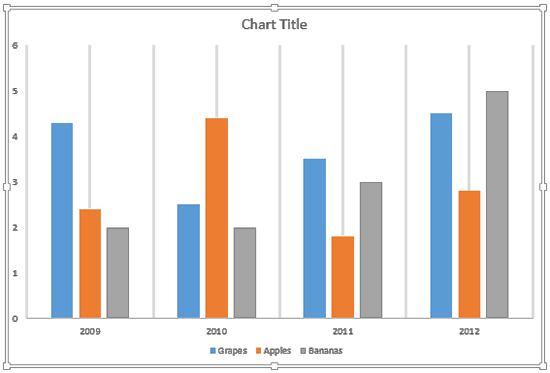
Gridlines are the lines that span wide and tall within the chart’s Plot Area. These Horizontal and Vertical gridlines originate from the axes, which makes the data easier to comprehend for the viewer. Gridlines may emerge from both the horizontal and vertical axes, although by default you can see only Horizontal gridlines on the chart.
To learn more, choose your version of PowerPoint. If we do not have a tutorial for your version of PowerPoint, explore the version closest to the one you use.
Microsoft Windows
Chart Gridlines in PowerPoint 2013
Apple Mac
Chart Gridlines in PowerPoint 2011
Tutorial Code: 10 04 01
Previous: 10 03 07 Apply Pattern Fills to Plot Area of Charts in PowerPoint
Next: 10 04 02 More Chart Gridline Options in PowerPoint