Monthly Archives: February 2021

Browse posts released in February 2021. See all archives.

See Also:
PowerPoint and Presenting Notes
PowerPoint and Presenting Glossary


Chart Data Table Options in PowerPoint February 26th, 2021
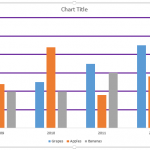
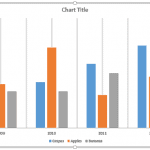
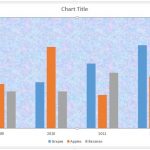
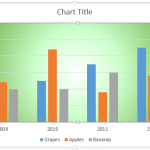
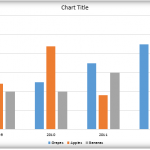
Chart Data: Chart Data Table Options in PowerPoint


Chart Data Table in PowerPoint February 25th, 2021
Chart Data: Chart Data Table in PowerPoint


More Chart Gridline Options in PowerPoint February 22nd, 2021
Chart Gridlines: More Chart Gridline Options in PowerPoint


Chart Gridlines in PowerPoint February 19th, 2021
Chart Gridlines: Chart Gridlines in PowerPoint


Apply Pattern Fills to Plot Area of Charts in PowerPoint February 17th, 2021
Plot Area: Apply Pattern Fills to Plot Area of Charts in PowerPoint


Apply Texture Fills to Plot Area of Charts in PowerPoint February 17th, 2021
Plot Area: Apply Texture Fills to Plot Area of Charts in PowerPoint


Apply Picture Fills to Plot Area of Charts in PowerPoint February 15th, 2021
Plot Area: Apply Picture Fills to Plot Area of Charts in PowerPoint


Apply Gradient Fills to Plot Area of Charts in PowerPoint February 14th, 2021
Plot Area: Apply Gradient Fills to Plot Area of Charts in PowerPoint


Apply Solid Fills to Plot Area of Charts in PowerPoint February 12th, 2021
Plot Area: Apply Solid Fills to Plot Area of Charts in PowerPoint


Apply Fills to Plot Area of Charts in PowerPoint February 12th, 2021
Plot Area: Apply Fills to Plot Area of Charts in PowerPoint


Plot Area in PowerPoint February 11th, 2021
Plot Area: Plot Area for Charts in PowerPoint


Paris Sims February 11th, 2021
Paris Sims


Text Effects for Chart Area in PowerPoint February 8th, 2021
Chart Area: Text Effects for Chart Area in PowerPoint


Text Fill & Outline Options for Chart Area in PowerPoint February 5th, 2021
Chart Area: Text Fill & Outline Options for Chart Area in PowerPoint


Size & Properties Options for Chart Area in PowerPoint February 4th, 2021
Chart Area: Size and Properties Options for Chart Area in PowerPoint


Effect Options for the Chart Area in PowerPoint February 2nd, 2021
Chart Area: Effect Options for the Chart Area in PowerPoint


Fill and Line Options for the Chart Area in PowerPoint February 1st, 2021
Chart Area: Fill and Line Options for the Chart Area in PowerPoint


Popular Posts

Add Office.com SmartArt Graphics Advanced SmartArt: Add Office.com SmartArt Graphics

SmartArt in PowerPoint has replaced the diagram options in previous versions of PowerPoint. SmartArt also allows you to replace bullet points with info-graphic content using text-within-shapes that are more logical to view and present. There are different SmartArt categories available. Additionally, you can also add an additional SmartArt category that shows content from Office.com. To ...


Theme Builder Theme Builder: Installing and Using Theme Builder in PowerPoint

Theme Builder is an application created by Microsoft to create and edit themes. The full name of the application is Microsoft Theme Builder, but for reasons of simplicity, we'll call it Theme Builder throughout this series of pages. As of now, Theme Builder is a Windows only application, but any Themes edited and created within ...


Vary Colors by Point Option for Charts in PowerPoint Advanced Chart Techniques: Vary Colors by Point Option for Charts in PowerPoint

When a column chart in PowerPoint contains only one data series and several categories, then, by default the individual chart columns may use the same fill color. If your chart uses the same colored series in all of the categories, it can make your chart look dull. To learn more, choose your version of PowerPoint ...


Microsoft and the Office logo are trademarks or registered trademarks of Microsoft Corporation in the United States and/or other countries.

Plagiarism will be detected by Copyscape

© 2000-2026, Geetesh Bajaj - All rights reserved.

since November 02, 2000