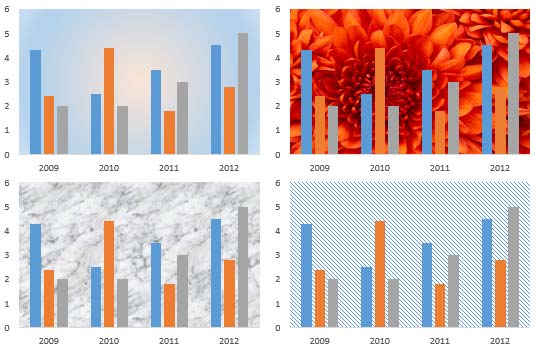
In a chart, the Plot Area is the backdrop upon which other chart elements such as Data Series and Gridlines are placed. This layer has axes on its perimeter. By default, the Plot Area has no fill attributes and is transparent. This may look plain, and that by itself is no reason to change the fill of the Plot Area.
To learn more, choose your version of PowerPoint. If we do not have a tutorial for your version of PowerPoint, explore the version closest to the one you use.
Microsoft Windows
Apply Fills to Plot Area of Charts in PowerPoint 2013
Apple Mac
Apply Fills to Plot Area of Charts in PowerPoint 2011
Tutorial Code: 10 03 02
Previous: 10 03 01 Plot Area for Charts in PowerPoint
Next: 10 03 03 Apply Solid Fills to Plot Area of Charts in PowerPoint