![]()
This is the print version of this page. All content is copyright Indezine.com 2000-2026.
![]()
Definitions and resources for terms and techniques used in the world of presentations
See Also:
PowerPoint and Presenting Notes
PowerPoint and Presenting Glossary
Presentations Glossary in alphabetical order:
A |
B |
C |
D |
E |
F |
G |
H |
I |
J |
K |
L |
M |
N |
O |
P |
Q |
R |
S |
T |
U |
V |
W |
X |
Y |
Z
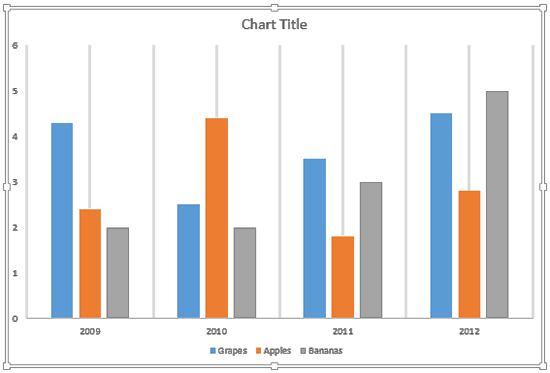
Gridlines are the lines that span wide and tall within the chart’s Plot Area. These Horizontal and Vertical gridlines originate from the axes, which makes the data easier to comprehend for the viewer. Gridlines may emerge from both the horizontal and vertical axes, although by default you can see only Horizontal gridlines on the chart.
To learn more, choose your version of PowerPoint. If we do not have a tutorial for your version of PowerPoint, explore the version closest to the one you use.
Chart Gridlines in PowerPoint 2013
Chart Gridlines in PowerPoint 2011
Tutorial Code: 10 04 01
Previous: 10 03 07 Apply Pattern Fills to Plot Area of Charts in PowerPoint
Next: 10 04 02 More Chart Gridline Options in PowerPoint
Filed Under:
C
Tagged as: 10-04, Chart Gridlines, Charts and Graphs, PowerPoint Tutorials
Comments Off on Chart Gridlines: Chart Gridlines in PowerPoint
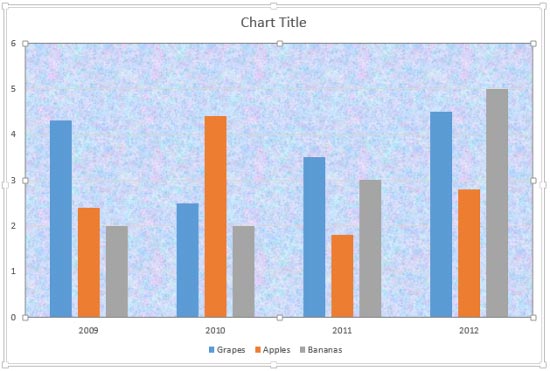
Patterns in PowerPoint are two-color designs comprising lines, dots, dashes, and checks. PowerPoint includes 48 patterns such patterns with names like Plaid, Weaves, Shingle, and Zig Zag. When used with some caution, Patterns can make a great fill for your Plot Area, similarly like any other fill.
To learn more, choose your version of PowerPoint. If we do not have a tutorial for your version of PowerPoint, explore the version closest to the one you use.
Apply Pattern Fills to Plot Area of Charts in PowerPoint 2013
Apply Pattern Fills to Plot Area of Charts in PowerPoint 2011

Tutorial Code: 10 03 07
Previous: 10 03 06 Apply Texture Fills to Plot Area of Charts in PowerPoint
Next: 10 04 01 Chart Gridlines in PowerPoint
Filed Under:
P
Tagged as: 10-03, Charts and Graphs, Plot Area, PowerPoint Tutorials
Comments Off on Plot Area: Apply Pattern Fills to Plot Area of Charts in PowerPoint
The Plot Area of a chart, which is transparent by default, can be enhanced with various fill types. But you should exercise some caution, a busy Plot Area will subdue the actual chart! This can be avoided by taking a little precaution while choosing the fill type and also when you apply it.
To learn more, choose your version of PowerPoint. If we do not have a tutorial for your version of PowerPoint, explore the version closest to the one you use.
Apply Texture Fills to Plot Area of Charts in PowerPoint 2013
Apply Texture Fills to Plot Area of Charts in PowerPoint 2011
Tutorial Code: 10 03 06
Previous: 10 03 05 Apply Picture Fills to Plot Area of Charts in PowerPoint
Next: 10 03 07 Apply Pattern Fills to Plot Area of Charts in PowerPoint
Filed Under:
P
Tagged as: 10-03, Charts and Graphs, Plot Area, PowerPoint Tutorials
Comments Off on Plot Area: Apply Texture Fills to Plot Area of Charts in PowerPoint
Picture fills can look great and distracting depending upon the type of picture you chose, and the object that you fill with the picture can also make a difference. If you need to use a picture as a fill for your chart’s Plot Area, then you must put in plenty of thought because you don’t want to crowd your chart. Therefore you can use a picture, but it’s best to use one that’s muted enough and does not attract too much attention.
To learn more, choose your version of PowerPoint. If we do not have a tutorial for your version of PowerPoint, explore the version closest to the one you use.
Apply Picture Fills to Plot Area of Charts in PowerPoint 2013
Apply Picture Fills to Plot Area of Charts in PowerPoint 2011

Tutorial Code: 10 03 05
Previous: 10 03 04 Apply Gradient Fills to Plot Area of Charts in PowerPoint
Next: 10 03 06 Apply Texture Fills to Plot Area of Charts in PowerPoint
Filed Under:
P
Tagged as: 10-03, Charts and Graphs, Plot Area, PowerPoint Tutorials
Comments Off on Plot Area: Apply Picture Fills to Plot Area of Charts in PowerPoint
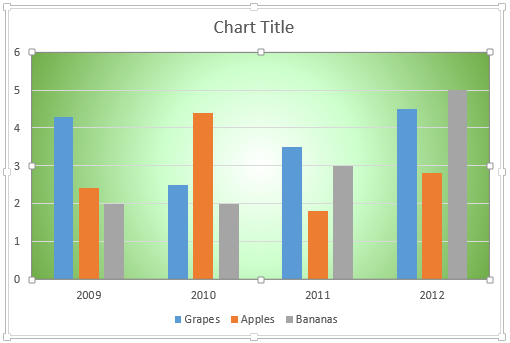
Gradient fills are typically blended fills between two or more colors that graduate from one color to another, and if you use neutral or muted colors, then a gradient fill can provide a great, understated backdrop for your chart.
To learn more, choose your version of PowerPoint. If we do not have a tutorial for your version of PowerPoint, explore the version closest to the one you use.
Apply Gradient Fills to Plot Area of Charts in PowerPoint 2013
Apply Gradient Fills to Plot Area of Charts in PowerPoint 2011
Tutorial Code: 10 03 04
Previous: 10 03 03 Apply Solid Fills to Plot Area of Charts in PowerPoint
Next: 10 03 05 Apply Picture Fills to Plot Area of Charts in PowerPoint
Filed Under:
P
Tagged as: 10-03, Charts and Graphs, Plot Area, PowerPoint Tutorials
Comments Off on Plot Area: Apply Gradient Fills to Plot Area of Charts in PowerPoint
Microsoft and the Office logo are trademarks or registered trademarks of Microsoft Corporation in the United States and/or other countries.