![]()
This is the print version of this page. All content is copyright Indezine.com 2000-2026.
![]()
Definitions and resources for terms and techniques used in the world of presentations
See Also:
PowerPoint and Presenting Notes
PowerPoint and Presenting Glossary
Presentations Glossary in alphabetical order:
A |
B |
C |
D |
E |
F |
G |
H |
I |
J |
K |
L |
M |
N |
O |
P |
Q |
R |
S |
T |
U |
V |
W |
X |
Y |
Z
In a PowerPoint chart, Data Labels are used to display various types of information. You can display the value, the name of the Chart Series, and/or the Categories right within or above the Series on the chart. Adding Data Labels can help the presenter reveal exact values along with the Series so that he or she need not check on the Value axis to ascertain approximate values of any Series.
To learn more, choose your version of PowerPoint. If we do not have a tutorial for your version of PowerPoint, explore the version closest to the one you use.
Chart Data Labels in PowerPoint 2013
Chart Data Labels in PowerPoint 2011

Tutorial Code: 10 06 01
Previous: 10 05 08 Creating Charts Using Existing Excel Data in PowerPoint
Next: 10 06 02 Chart Data Label Format Options in PowerPoint
Filed Under:
C
Tagged as: 10-06, Chart Data Labels, Charts and Graphs, PowerPoint Tutorials
Comments Off on Chart Data Labels: Chart Data Labels in PowerPoint
You may have started from scratch with inserting a new chart on your PowerPoint slide. This of course brings up an instance of the Excel sheet with some dummy data, and indeed you can type in your own data to replace this dummy data.
To learn more, choose your version of PowerPoint. If we do not have a tutorial for your version of PowerPoint, explore the version closest to the one you use.
Creating Charts Using Existing Excel Data in PowerPoint 2013
Creating Charts Using Existing Excel Data in PowerPoint 2011

Tutorial Code: 10 05 08
Previous: 10 05 07 Switch Series and Categories for Charts in PowerPoint
Next: 10 06 01 Chart Data Labels in PowerPoint
Filed Under:
C
Tagged as: 10-05, Chart Data, Charts and Graphs, PowerPoint Tutorials
Comments Off on Chart Data: Creating Charts Using Existing Excel Data in PowerPoint
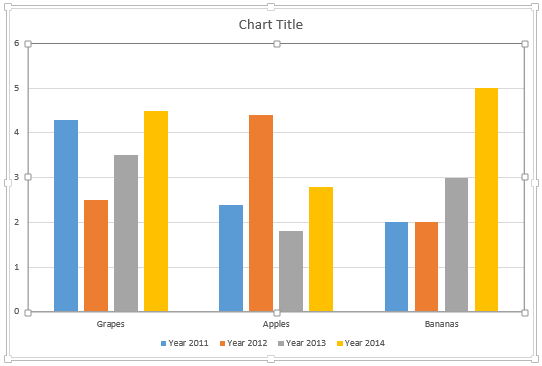
Any typical column chart contains two sets of data, one set shows as the Series within your charts, and the other set ends up representing the Categories. By default, the Series show up as the Legend (and columns) within the chart. Categories on the other hand constitute the groups of these individual columns.
To learn more, choose your version of PowerPoint. If we do not have a tutorial for your version of PowerPoint, explore the version closest to the one you use.
Switch Series and Categories for Charts in PowerPoint 2013
Switch Series and Categories for Charts in PowerPoint 2011
Tutorial Code: 10 05 07
Previous: 10 05 06 Change Order of Chart Data Series in PowerPoint
Next: 10 05 08 Creating Charts Using Existing Excel Data in PowerPoint
Filed Under:
C
Tagged as: 10-05, Chart Data, Charts and Graphs, PowerPoint Tutorials
Comments Off on Chart Data: Switch Series and Categories for Charts in PowerPoint
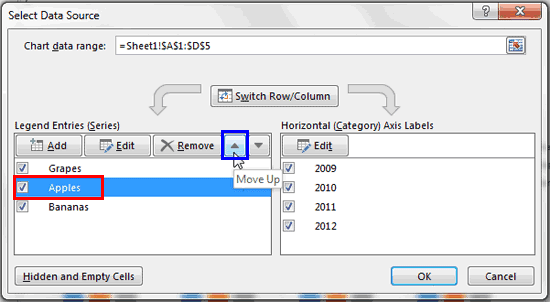
Typically the Data Series of a chart in PowerPoint is displayed in the exact sequence in which it is contained within the Excel sheet. If you want to change the order of the Data Series within the chart, you access the Excel sheet containing the chart data and reorder the columns representing the Data Series.
To learn more, choose your version of PowerPoint. If we do not have a tutorial for your version of PowerPoint, explore the version closest to the one you use.
Change Order of Chart Data Series in PowerPoint 2013
Change Order of Chart Data Series in PowerPoint 2011
Tutorial Code: 10 05 06
Previous: 10 05 05 Hiding Chart Series and Categories in PowerPoint
Next: 10 05 07 Switch Series and Categories for Charts in PowerPoint
Filed Under:
C
Tagged as: 10-05, Chart Data, Charts and Graphs, PowerPoint Tutorials
Comments Off on Chart Data: Change Order of Chart Data Series in PowerPoint
In PowerPoint, the entire chart data that shows up in the form of series and categories is actually stored within an Excel sheet. These series and categories may show up on your chart in different ways depending upon the chart type. Almost any chart type, even if it is not a column chart, compares one set of values with another.
To learn more, choose your version of PowerPoint. If we do not have a tutorial for your version of PowerPoint, explore the version closest to the one you use.
Hiding Chart Series and Categories in PowerPoint 2013
Hiding Chart Series and Categories in PowerPoint 2011

Tutorial Code: 10 05 05
Previous: 10 05 04 Adding and Deleting Chart Series and Categories in PowerPoint
Next: 10 05 06 Change Order of Chart Data Series in PowerPoint
Filed Under:
C
Tagged as: 10-05, Chart Data, Charts and Graphs, PowerPoint Tutorials
Comments Off on Chart Data: Hiding Chart Series and Categories in PowerPoint
Microsoft and the Office logo are trademarks or registered trademarks of Microsoft Corporation in the United States and/or other countries.