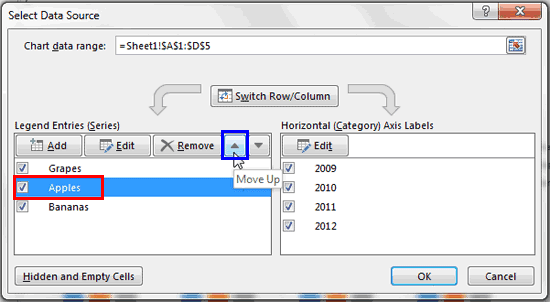
Typically the Data Series of a chart in PowerPoint is displayed in the exact sequence in which it is contained within the Excel sheet. If you want to change the order of the Data Series within the chart, you access the Excel sheet containing the chart data and reorder the columns representing the Data Series.
To learn more, choose your version of PowerPoint. If we do not have a tutorial for your version of PowerPoint, explore the version closest to the one you use.
Microsoft Windows
Change Order of Chart Data Series in PowerPoint 2013
Apple Mac
Change Order of Chart Data Series in PowerPoint 2011
Tutorial Code: 10 05 06
Previous: 10 05 05 Hiding Chart Series and Categories in PowerPoint
Next: 10 05 07 Switch Series and Categories for Charts in PowerPoint