![]()
This is the print version of this page. All content is copyright Indezine.com 2000-2026.
![]()
Definitions and resources for terms and techniques used in the world of presentations
See Also:
PowerPoint and Presenting Notes
PowerPoint and Presenting Glossary
Presentations Glossary in alphabetical order:
A |
B |
C |
D |
E |
F |
G |
H |
I |
J |
K |
L |
M |
N |
O |
P |
Q |
R |
S |
T |
U |
V |
W |
X |
Y |
Z
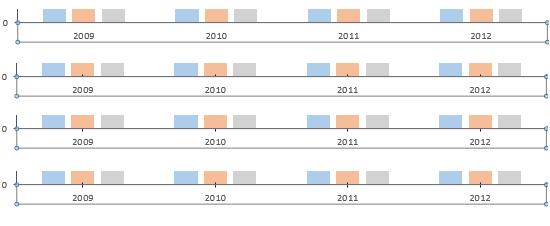
Tick marks in charts are indications placed on the axis that help you get a better idea about chart values. Major tick marks are indications on an axis that show up between categories on the categories axis, and besides major unit values on the value axis. Minor tick marks are those tick marks that appear between major tick marks on an axis.
To learn more, choose your version of PowerPoint. If we do not have a tutorial for your version of PowerPoint, explore the version closest to the one you use.
Tick Marks on Chart Axes in PowerPoint 2013
Tick Marks on Chart Axes in PowerPoint 2010
Tick Marks on Chart Axes in PowerPoint 2011
Tutorial Code: 10 08 04
Previous: 10 08 03 Set Minimum and Maximum Values on Value Axis in PowerPoint
Next: 10 08 05 Change Major and Minor Units of Value Axis in PowerPoint
Filed Under:
C
Tagged as: 10-08, Chart Axes, Charts and Graphs, PowerPoint Tutorials
Comments Off on Chart Axes: Tick Marks in PowerPoint
Do you like the default locations where PowerPoint places your axes’ labels? Yes, we do believe that the defaults do work best most of the time because audiences expect these labels to exist at these familiar locations. However, there may be times when you probably don’t even need labels for your axes, or you may want them placed in another location so that your charts look cleaner. Whatever your motive may be, it is indeed possible to change the position of axis labels vis-à-vis the axis.
To learn more, choose your version of PowerPoint. If we do not have a tutorial for your version of PowerPoint, explore the version closest to the one you use.
Reposition and Hide Axis Labels in PowerPoint 2013
Reposition and Hide Axis Labels in PowerPoint 2011

Tutorial Code: 10 08 07
Previous: 10 08 06 Changing Axis Labels in PowerPoint
Next: 10 08 08 Add Secondary Value Axis to Charts in PowerPoint
Filed Under:
C
Tagged as: 10-08, Chart Axes, Charts and Graphs, PowerPoint Tutorials
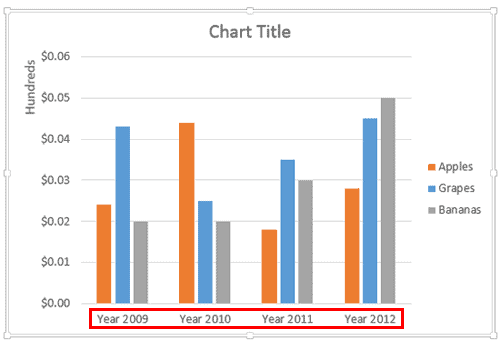
Axis labels, as the name suggests are labels for categories and values on your chart axes. Category names show as labels on the category axis. Similarly, values show as labels on the value axis. If you have a depth (series) axis in your chart, then series names show up as the labels on this axis.
To learn more, choose your version of PowerPoint. If we do not have a tutorial for your version of PowerPoint, explore the version closest to the one you use.
Changing Axis Labels in PowerPoint 2013
Changing Axis Labels in PowerPoint 2010
Changing Axis Labels in PowerPoint 2011
Tutorial Code: 10 08 06
Previous: 10 08 05 Change Major and Minor Units of Value Axis in PowerPoint
Next: 10 08 07 Reposition and Hide Axis Labels in PowerPoint
Filed Under:
C
Tagged as: 10-08, Chart Axes, Charts and Graphs, PowerPoint Tutorials
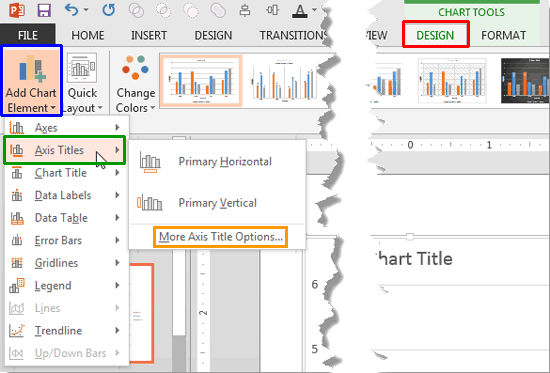
The text used to label chart axes in a chart is called an axis title. Most chart types with a few exceptions such as the pie and doughnut charts have axes. Although radar charts have an axis, there is no provision to add axis titles for them. In all other chart types such as column, line, etc., axis titles are not visible by default.
To learn more, choose your version of PowerPoint. If we do not have a tutorial for your version of PowerPoint, explore the version closest to the one you use.
Axis Titles in PowerPoint 2013
Axis Titles in PowerPoint 2010
Axis Titles in PowerPoint 2011
Tutorial Code: 10 08 02
Previous: 10 08 01 Axes in PowerPoint
Next: 10 08 03 Set Minimum and Maximum Values on Value Axis in PowerPoint
Filed Under:
C
Tagged as: 10-08, Chart Axes, Charts and Graphs, PowerPoint Tutorials
Comments Off on Chart Axes: Axis Titles in PowerPoint

Ric Bretschneider spent over 16 years on the Microsoft PowerPoint team building features within the product. Ric founded the San Jose, CA branch of the Pecha Kucha presentation event, and can occasionally be heard on his Presentations Roundtable podcast, promoting excellence in design and technique through interviews of industry professionals.
Here’s a list of links on Indezine.com where he has been featured:
 Presentation Summit 2024: Conversation with Ric Bretschneider
September 10, 2024
 Presentation Summit 2023: Conversation with Ric Bretschneider
August 9, 2023
 Presentation Summit 2022: Conversation with Ric Bretschneider
September 1, 2022
Filed Under:
R
Tagged as: MVP, Personality
Comments Off on Ric Bretschneider
Microsoft and the Office logo are trademarks or registered trademarks of Microsoft Corporation in the United States and/or other countries.