![]()
This is the print version of this page. All content is copyright Indezine.com 2000-2026.
![]()
Definitions and resources for terms and techniques used in the world of presentations
See Also:
PowerPoint and Presenting Notes
PowerPoint and Presenting Glossary
Presentations Glossary in alphabetical order:
A |
B |
C |
D |
E |
F |
G |
H |
I |
J |
K |
L |
M |
N |
O |
P |
Q |
R |
S |
T |
U |
V |
W |
X |
Y |
Z

Jamie Garroch is a Technical Consultant at BrightCarbon, the specialist presentation and eLearning agency. He develops PowerPoint automation solutions and add-ins that enable presentation authors to work smarter. He also trains people to present more effectively using visuals and animated scenes that explain and reinforce key messages, which is supported by free resources and tips at their site.
Here’s a list of links on Indezine.com where he has been featured:
 Social Media Canvas Add-in: Conversation with Jamie Garroch
October 17, 2025
 Collapse Groups with BrightSlide in PowerPoint’s Selection Pane
March 24, 2023
Hide Logos with Logo Toggle in PowerPoint
September 9, 2021
Presentation Summit 2021: Conversation with Jamie Garroch
August 24, 2021
 Convert a PowerPoint Line to a Motion Path Animation: Conversation with Jamie Garroch
December 22, 2020
Presentation Summit 2020: Conversation with Jamie Garroch
June 15, 2020
 BrightSlide: Creating a Revolutionary PowerPoint Add-in
October 31, 2019
PowerPoint VBA: Export Slides to Single Slide Presentations
October 16, 2019
Presentation Summit 2019: Conversation with Jamie Garroch
September 11, 2019
Jamie’s Pattern Fill Transparency Add-in for PowerPoint
January 30, 2018
 YOUpresent and Nolan Haims Creative Launch Free TalkTime Add-in for PowerPoint
October 27, 2017
 Manage Guides in PowerPoint with G-Tools: Conversation with Jamie Garroch
May 24, 2017
 Vimeo Embeds with G-Tools PowerPoint Add-in: Conversation with Jamie Garroch
January 13, 2016
 Convert Text to Outlines in PowerPoint 2013 with a Free Add-in
January 2, 2014
 Color Swatch for PowerPoint 2003: Conversation with Jamie Garroch
September 30, 2013
 vMaps’ Auto Color Feature: Conversation with Jamie Garroch
January 10, 2013
 PowerPoint 2013 for Developers: Conversation with Jamie Garroch
August 17, 2012
 Slide Linker: Conversation with Jamie Garroch
December 14, 2011
 Circlify: Conversation with Jamie Garroch
August 15, 2011
 PowerPoint, a Graphics Program: Conversation with Jamie Garroch
August 5, 2011
Presenting on an iPad: Conversation with Jamie Garroch
February 9, 2011
 PowerPoint on iPad
January 28, 2011
 Building an Interactive Public Transport Map Application in PowerPoint
September 3 ,2010
ActivePresentation™ Designer: Conversation with Jamie Garroch
July 23, 2010
 ActivePresentation™ Designer
June 28, 2010
Filed Under:
J
Tagged as: Add-in, Jamie Garroch, Personality, PowerPoint, PowerPoint Converstations, Programming, VBA
PowerPoint provides ample choices in chart types for almost every kind of graphical data representation. There are some basic chart types such as column, bar, line, pie, etc. and advanced charts like radar, surface, bubble, doughnut, etc.
To learn more, choose your version of PowerPoint. If we do not have a tutorial for your version of PowerPoint, explore the version closest to the one you use.
Changing Chart Types in PowerPoint 2013
Changing Chart Types in PowerPoint 2010
Changing Chart Types in PowerPoint 2007
Changing Charts Types in PowerPoint 2002 and 2003
Changing Chart Types in PowerPoint 2011

Tutorial Code: 10 01 04
Previous: 10 01 03 Chart Elements in PowerPoint
Next: 10 01 05 Changing Fill and Border of Charts in PowerPoint
Filed Under:
C
Tagged as: 10-01, Chart Basics, Charts and Graphs, PowerPoint Tutorials
Comments Off on Chart Basics: Changing Chart Types in PowerPoint
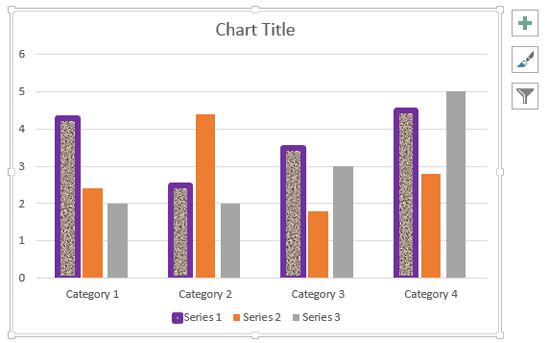
When a new chart is inserted in your PowerPoint presentation, you will find that it takes the fills and border types based on the Theme of your presentation. You can change the fills and borders of charts as required. Other than that, you can always use pictures as fills.
To learn more, choose your version of PowerPoint. If we do not have a tutorial for your version of PowerPoint, explore the version closest to the one you use.
Picture Fills for Chart Series in PowerPoint 2010
Picture Fills for Chart Series in PowerPoint 2007
Picture Fills for Chart Series in PowerPoint 2003 and 2002
Picture Fills for Chart Series in PowerPoint 2011

Tutorial Code: 10 10 01
Previous: 10 09 01 Chart Legend in PowerPoint
Next: 10 11 01 Z Axis in PowerPoint Charts: Pros and Cons
Filed Under:
C
Tagged as: 10-10, Chart Series, Charts and Graphs, PowerPoint Tutorials
Comments Off on Chart Series: Picture Fills for Chart Series in PowerPoint
Although a chart may seem like a single object at first glance, look closer and you will find that each chart comprises several individual elements that we call chart elements in PowerPoint.
To learn more, choose your version of PowerPoint. If we do not have a tutorial for your version of PowerPoint, explore the version closest to the one you use.
Chart Elements in PowerPoint 2013
Chart Elements in PowerPoint 2010
Chart Elements in PowerPoint 2007
Chart Elements in PowerPoint 2002 and 2003
Chart Elements in PowerPoint 2011
Tutorial Code: 10 01 03
Previous: 10 01 02 Chart Styles in PowerPoint
Next: 10 01 04 Changing Chart Types in PowerPoint
Filed Under:
C
Tagged as: 10-01, Chart Basics, Charts and Graphs, PowerPoint Tutorials
Comments Off on Chart Basics: Chart Elements in PowerPoint
The default fill and border (line) that PowerPoint applies to chart elements are perfectly adequate. If you want something different, play with various Chart Styles available. While this works great most of the time, there will be occasions when you may want to use a particular color for any of your data series that’s not part of the Theme palette in your presentation. In times like these, you can change the fill and border of chart elements manually using the techniques explained.
To learn more, choose your version of PowerPoint. If we do not have a tutorial for your version of PowerPoint, explore the version closest to the one you use.
Changing Fill and Border of Charts in PowerPoint 2013
Changing Fill and Border of Charts in PowerPoint 2010
Changing Fill and Border of Charts in PowerPoint 2007
Changing Fills and Border of Charts in PowerPoint 2002 and 2003
Changing Fill and Border of Charts in PowerPoint 2011
Tutorial Code: 10 01 05
Previous: 10 01 04 Changing Chart Types in PowerPoint
Next: 10 01 06 Quick Layouts for Charts in PowerPoint
Filed Under:
C
Tagged as: 10-01, Chart Basics, Charts and Graphs, PowerPoint Tutorials
Comments Off on Charts: Changing Fill and Border of Chart Elements in PowerPoint
Microsoft and the Office logo are trademarks or registered trademarks of Microsoft Corporation in the United States and/or other countries.