![]()
This is the print version of this page. All content is copyright Indezine.com 2000-2026.
![]()
Definitions and resources for terms and techniques used in the world of presentations
See Also:
PowerPoint and Presenting Notes
PowerPoint and Presenting Glossary
Presentations Glossary in alphabetical order:
A |
B |
C |
D |
E |
F |
G |
H |
I |
J |
K |
L |
M |
N |
O |
P |
Q |
R |
S |
T |
U |
V |
W |
X |
Y |
Z
Line charts can display continuous data over time, set against a common scale, and are therefore ideal for showing trends in data at equal intervals. In a line chart, category data is distributed evenly along the horizontal axis, and all value data is distributed evenly along the vertical axis.
To learn more, click a link from the tutorials listed below.

Tutorial Code: 10 14 04
Previous: 10 14 03 Bar Charts in PowerPoint
Next: 10 14 05 Pie Charts in PowerPoint
Filed Under:
P
Tagged as: 10-14, Charts and Graphs, PowerPoint Chart Types, PowerPoint Tutorials
Comments Off on PowerPoint Chart Types: Line Charts in PowerPoint
While it is easy to change proofing language for selected text containers, that happens to be a piece meal approach and can be a wonderful timewaster if you need the language changed across all content in a hundred or more slides! There are two ways to set the proofing language for your entire presentation, and you can use one or both approaches. Make sure you have the proofing tools installed for all or any of the languages that you need to work within PowerPoint.
To learn more, choose your version of PowerPoint. If we do not have a tutorial for your version of PowerPoint, explore the version closest to the one you use.
Changing Proofing Language for an Entire Presentation in PowerPoint 365
Changing Proofing Language for an Entire Presentation in PowerPoint 2013
Changing Proofing Language for an Entire Presentation in PowerPoint 2010
Changing Proofing Language for an Entire Presentation in PowerPoint 2011

Tutorial Code: 05 08 20
Previous: 05 08 19 Setting Proofing Language for Text in PowerPoint
Next: 05 08 21 Research Tools in PowerPoint
Filed Under:
S
Tagged as: 05-08, PowerPoint Tutorials, Spelling AutoCorrect and Reference Tools, Text and Fonts
Comments Off on Spelling, AutoCorrect, and Reference Tools: Changing Proofing Language for an Entire Presentation
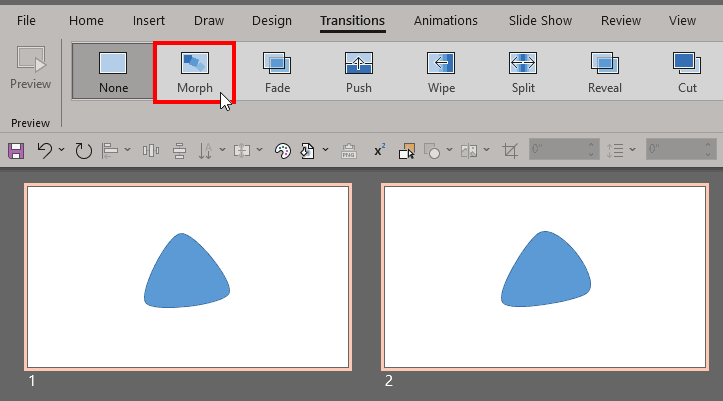
We already looked at getting started with the Morph transition in PowerPoint. In this next tutorial of the Morph transition series, we will look at using the Curve line tool to create some drawings. These drawings can be duplicated on subsequent slides and edited slightly in each slide. The results can differ depending upon what you draw. While it will be great if you have artistic skills to draw within PowerPoint, it doesn’t matter if you cannot draw. We will also provide a sample presentation and video walkthrough to help.
To learn more, click a link from the tutorials listed below.
Using the Morph Transition with Curve Shapes in PowerPoint
Tutorial Code: 13 10 02
Previous: 13 10 01 Getting Started with Morph in PowerPoint
Next: 13 10 03 Using Exclamation Named Objects with Morph in PowerPoint
Filed Under:
M
Tagged as: 13-10, Animations and Transitions, Morph in PowerPoint, PowerPoint Tutorials
Comments Off on Morph in PowerPoint: Using the Morph Transition with Curve Shapes in PowerPoint
A Bar chart maps data using bars within a chart’s Plot area. A bar is essentially a rectangle that’s typically thin width-wise and long length-wise. In simple terms, a Bar chart is a Column chart with columns rotated 90 degrees!
To learn more, click a link from the tutorials listed below.

Tutorial Code: 10 14 03
Previous: 10 14 02 Column Charts in PowerPoint
Next: 10 14 04 Line Charts in PowerPoint
Filed Under:
P
Tagged as: 10-14, Charts and Graphs, PowerPoint Chart Types, PowerPoint Tutorials
Comments Off on PowerPoint Chart Types: Bar Charts in PowerPoint

Maurizio La Cava is a digital entrepreneur, marketer, blogger, public speaker, presentation design guru, and Founder at MLC-Design.
He is also the author of Lean Presentation Design, a top-rated freelancer, and a Professor at the European Institute of Design in Milan. His favorite quote is “Time is free but it’s priceless”.
Here’s a list of links on Indezine sites, where he has been featured:
 Lean Presentation Design: Conversation with Maurizio La Cava
November 23, 2016
MLC add-in for PowerPoint: Conversation with Maurizio La Cava
March 9, 2016
Filed Under:
M
Tagged as: Maurizio La Cava, Personality
Comments Off on Maurizio La Cava
Microsoft and the Office logo are trademarks or registered trademarks of Microsoft Corporation in the United States and/or other countries.