![]()
This is the print version of this page. All content is copyright Indezine.com 2000-2026.
![]()
Definitions and resources for terms and techniques used in the world of presentations
See Also:
PowerPoint and Presenting Notes
PowerPoint and Presenting Glossary
Presentations Glossary in alphabetical order:
A |
B |
C |
D |
E |
F |
G |
H |
I |
J |
K |
L |
M |
N |
O |
P |
Q |
R |
S |
T |
U |
V |
W |
X |
Y |
Z
It’s so awesome that PowerPoint and other Microsoft Office programs offer so many keyboard shortcuts, but has it ever happened that you press a keyboard shortcut in PowerPoint, and it does not work? No, there’s nothing wrong with the keyboard shortcut you pressed, or even with PowerPoint. There may be any number of other reasons for the keyboard shortcut not working.
To learn more, click a link from the tutorials listed below.
PowerPoint Keyboard Shortcuts Not Working

Tutorial Code: 02 01 04
Previous: 02 01 03 Troubleshooting Menu Activation in PowerPoint
Next: 02 02 01 Enable the Missing Developer Tab in the Ribbon in PowerPoint
Filed Under:
K
Tagged as: 02-01, Customize PowerPoint, Keyboard Shortcuts and Sequences, PowerPoint Tutorials
Comments Off on Keyboard Shortcuts and Sequences: PowerPoint Keyboard Shortcuts Not Working
Once you have inserted an organization chart (org chart) within PowerPoint, you might need to change its layout. The “layout” means how the subordinate levels in the hierarchy branch out from top to bottom. Probably you want all subordinates flushed to the left, hanging to the right, or distributed evenly across a horizontal plane.
To learn more, choose your version of PowerPoint. If we do not have a tutorial for your version of PowerPoint, explore the version closest to the one you use.
Change Layout of Organization Chart in PowerPoint 2013
Change Layout of Organization Chart in PowerPoint 2010
Change Layout of Organization Chart in PowerPoint 2011

Tutorial Code: 11 04 03
Previous: 11 04 02 Adding New Shapes to Existing Organization Charts
Next: 12 01 01 Insert Tables in PowerPoint
Filed Under:
O
Tagged as: 11-04, Organization Charts, PowerPoint Tutorials, SmartArt Graphics
Comments Off on Organization Charts: Change Layout of Organization Chart
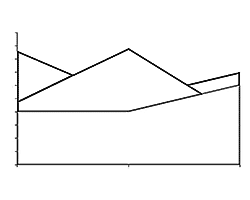
Area charts emphasize the magnitude of change over time, and can be used to draw attention to the total value across a trend. For example, data that represents profit over time can be plotted in an area chart to emphasize the total profit. By displaying the sum of the plotted values, an area chart also shows the relationship of parts to a whole.
To learn more, click a link from the tutorials listed below.
Tutorial Code: 10 14 06
Previous: 10 14 05 Pie Charts in PowerPoint
Next: 10 14 07 XY (Scatter) Chart Type in PowerPoint
Filed Under:
P
Tagged as: 10-14, Charts and Graphs, PowerPoint Chart Types, PowerPoint Tutorials
Comments Off on PowerPoint Chart Types: Area Charts in PowerPoint
After inserting an organization chart (org chart) in PowerPoint, you might need to add more shapes to your org chart. The default org chart that PowerPoint places has a few shapes. However, you might want to add more shapes, as well as newer hierarchy levels for the new shapes you add.
To learn more, choose your version of PowerPoint. If we do not have a tutorial for your version of PowerPoint, explore the version closest to the one you use.
Adding New Shapes to Existing Organization Charts in PowerPoint 2013
Adding New Shapes to Existing Organization Charts in PowerPoint 2010
Adding New Shapes to Existing Organization Charts in PowerPoint 2011

Tutorial Code: 11 04 02
Previous: 11 04 01 Insert an Organization Chart
Next: 11 04 03 Change Layout of Organization Chart
Filed Under:
O
Tagged as: 11-04, Organization Charts, PowerPoint Tutorials, SmartArt Graphics
Comments Off on Organization Charts: Adding New Shapes to Existing Organization Charts
You won’t find an option to add an Organization Chart in the Insert tab of the Ribbon in PowerPoint. Instead, you will find the SmartArt option in the Insert tab, and organization charts are just one of the many variants of SmartArt graphics you can insert into your slide. An organization chart graphically represents the management or hierarchical structure of an organization.
To learn more, choose your version of PowerPoint. If we do not have a tutorial for your version of PowerPoint, explore the version closest to the one you use.
Insert an Organization Chart in PowerPoint 2013
Insert an Organization Chart in PowerPoint 2010
Insert an Organization Chart in PowerPoint 2011
Tutorial Code: 11 04 01
Previous: 11 03 10 Reset SmartArt Graphics in PowerPoint
Next: 11 04 02 Adding New Shapes to Existing Organization Charts
Filed Under:
O
Tagged as: 11-04, Organization Charts, PowerPoint Tutorials, SmartArt Graphics
Comments Off on Organization Charts: Insert an Organization Chart
Microsoft and the Office logo are trademarks or registered trademarks of Microsoft Corporation in the United States and/or other countries.