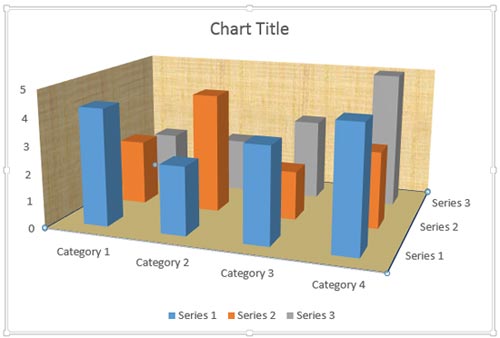
Let’s imagine your slide background is filled with some picture or texture. This may cause your chart columns to appear merged with the background. In such a situation, you can make your chart columns prominent by formatting the walls and floor of your 3D chart.
To learn more, choose your version of PowerPoint. If we do not have a tutorial for your version of PowerPoint, explore the version closest to the one you use.
Microsoft Windows
Format Walls and Floor of 3D Charts in PowerPoint 2013
Apple Mac
Format Walls and Floor of 3D Charts in PowerPoint 2011
Tutorial Code: 10 11 04
Previous: 10 11 03 Rotate 3D Charts in PowerPoint
Next: 10 12 01 Adjust the Chart Gap Width in PowerPoint