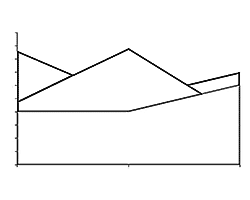
Area charts emphasize the magnitude of change over time, and can be used to draw attention to the total value across a trend. For example, data that represents profit over time can be plotted in an area chart to emphasize the total profit. By displaying the sum of the plotted values, an area chart also shows the relationship of parts to a whole.
To learn more, click a link from the tutorials listed below.
All Versions

Tutorial Code: 10 14 06
Previous: 10 14 05 Pie Charts in PowerPoint
Next: 10 14 07 XY (Scatter) Chart Type in PowerPoint
