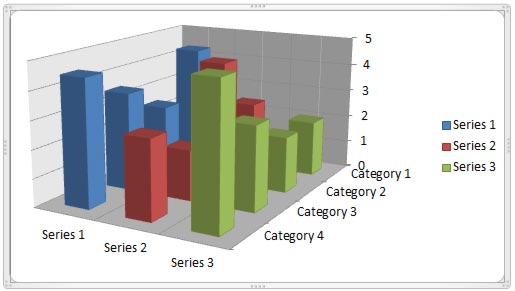
The Z axis is the depth axis that some 3D charts contain. Sometimes, the Z axis is also called the series axis. Let us be clear about the fact that not all 3D charts contain a Z axis. In fact, some 3D chart variants use the third dimension even if they do not need a Z axis! They do so just because some people wrongly believe that 3D is so cool.
To learn more, choose your version of PowerPoint. If we do not have a tutorial for your version of PowerPoint, explore the version closest to the one you use.
All Versions
Z Axis in PowerPoint Charts: Pros and Cons
Tutorial Code: 10 11 01
Previous: 10 10 01 Picture Fills for Chart Series in PowerPoint
Next: 10 11 02 Make 3D Columns Semi-Transparent for Charts in PowerPoint