Data Labels in PowerPoint are used to display the value, and/or the name of the Chart Series, and/or Categories right within or above the Series on the chart. In versions older than PowerPoint, Data Labels were contained within a plain text box.
To learn more, choose your version of PowerPoint. If we do not have a tutorial for your version of PowerPoint, explore the version closest to the one you use.
Microsoft Windows
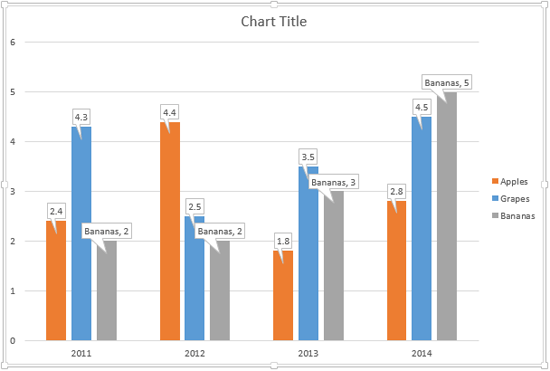
Callout Data Labels for Charts in PowerPoint 2013
Tutorial Code: 10 06 03
Previous: 10 06 02 Chart Data Label Format Options in PowerPoint
Next: 10 06 04 Change Callout Shapes for Data Labels in PowerPoint