![]()
This is the print version of this page. All content is copyright Indezine.com 2000-2026.
![]()
Definitions and resources for terms and techniques used in the world of presentations
See Also:
PowerPoint and Presenting Notes
PowerPoint and Presenting Glossary
Presentations Glossary in alphabetical order:
A |
B |
C |
D |
E |
F |
G |
H |
I |
J |
K |
L |
M |
N |
O |
P |
Q |
R |
S |
T |
U |
V |
W |
X |
Y |
Z
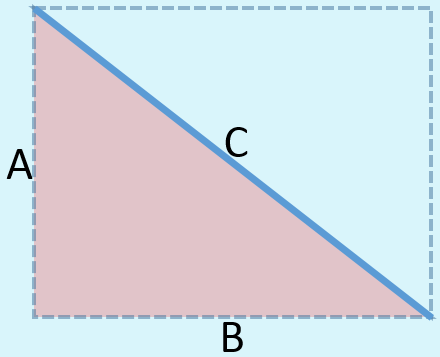
Sometimes, when you draw a line in PowerPoint that is slanted or sloped, you may thereafter want to know the length of your line. Believe it or not, there is no option to do this within the program!
To learn more, choose your version of PowerPoint. If we do not have a tutorial for your version of PowerPoint, explore the version closest to the one you use.
Finding Length of a Diagonal Line in PowerPoint 365
Finding Length of a Diagonal Line in PowerPoint 2013
Finding Length of a Diagonal Line in PowerPoint 365
Finding Length of a Diagonal Line in PowerPoint 2011
Finding Length of a Diagonal Line in PowerPoint for the Web
Tutorial Code: 06 02 05
Previous: 06 02 04 Change a Diagonal Line to a Horizontal or Vertical Line in PowerPoint
Next: 06 02 06 Flip and Rotate Picture Fills for Shapes in PowerPoint
Filed Under:
A
Tagged as: 06-02, Advanced Shape Techniques, PowerPoint Tutorials, Shapes
Comments Off on Advanced Shape Techniques: Finding Length of a Diagonal Line in PowerPoint
PowerPoint provides ample choices in chart types for almost every kind of graphical data representation. However, as you probably know all charts are not equal. Charts should be chosen depending upon the topic of your presentation, your audience, and the disposition of the presenter.
To learn more, choose your version of PowerPoint. If we do not have a tutorial for your version of PowerPoint, explore the version closest to the one you use.

Tutorial Code: 10 14 01
Previous: 10 13 02 Where are Chart Templates Saved in PowerPoint
Next: 10 14 02 Column Charts in PowerPoint
Filed Under:
P
Tagged as: 10-14, Charts and Graphs, PowerPoint Chart Types, PowerPoint Tutorials
Comments Off on PowerPoint Chart Types: Chart Types in PowerPoint
You can see some samples of SmartArt created within PowerPoint. Each sample has a caption that tells you the name of that particular SmartArt graphic variant.
To learn more, choose your version of PowerPoint. If we do not have a tutorial for your version of PowerPoint, explore the version closest to the one you use.

Tutorial Code: 11 01 05
Previous: 11 01 04 What is SmartArt?
Next: 11 02 01 Adding New Shape(s) to Existing SmartArt Graphic in PowerPoint
Filed Under:
S
Tagged as: 11-01, PowerPoint Tutorials, SmartArt Basics, SmartArt Graphics
Comments Off on SmartArt Basics: Some SmartArt Samples

John Mackenzie is originally a business film director, before companies had in-house video departments, John would often bring client script reviews to a jaw-dropping halt with phrases such as: “This scene will need a B-wind internegative for optical bench processing”.
Here’s a list of links on Indezine sites, where he has been featured:
 Using Sales Meetings for Career Acceleration: 15 Black-Belt Meeting Master Moves
January 2, 2005
Filed Under:
J
Tagged as: Personality
Comments Off on John Mackenzie
SmartArt is a diagramming component first introduced within PowerPoint 2007 for Windows, and now available on most platforms where PowerPoint is available including Windows, Mac, Android, iOS, etc. Among other niceties, SmartArt allows you to replace boring bullet points with info-graphic content using text within shapes.
To learn more, choose your version of PowerPoint. If we do not have a tutorial for your version of PowerPoint, explore the version closest to the one you use.

Tutorial Code: 11 01 04
Previous: 11 01 03 Convert SmartArt Graphics to Text in PowerPoint
Next: 11 01 05 Some SmartArt Samples
Filed Under:
S
Tagged as: 11-01, PowerPoint Tutorials, SmartArt Basics, SmartArt Graphics
Comments Off on SmartArt Basics: What is SmartArt?
Microsoft and the Office logo are trademarks or registered trademarks of Microsoft Corporation in the United States and/or other countries.