![]()
This is the print version of this page. All content is copyright Indezine.com 2000-2026.
![]()
Definitions and resources for terms and techniques used in the world of presentations
See Also:
PowerPoint and Presenting Notes
PowerPoint and Presenting Glossary
Presentations Glossary in alphabetical order:
A |
B |
C |
D |
E |
F |
G |
H |
I |
J |
K |
L |
M |
N |
O |
P |
Q |
R |
S |
T |
U |
V |
W |
X |
Y |
Z
When Microsoft introduced SmartArt as part of Office, it essentially created one of the most welcomed and used features in all of Microsoft Office programs. People loved this feature, and you will still find that so many users are amazed by the fact that you can convert some bulleted text on a PowerPoint slide into a graphic with one click! In addition to creating SmartArt, and including a bunch of some great variants out of the box, Microsoft also created a way for individuals and developers to create their own custom SmartArt Layout files.
To learn more, click a link from the tutorials listed below.
Tutorial Code: 11 03 09
Previous: 11 03 08 Creating Timelines Using SmartArt in PowerPoint
Next: 11 03 10 Reset SmartArt Graphics in PowerPoint
Filed Under:
A
Tagged as: 11-03, Advanced, PowerPoint Tutorials, SmartArt, SmartArt Graphics
Comments Off on Advanced SmartArt: Get More SmartArt Graphics
Sometimes you need to draw multiple shapes of the same type on a slide, maybe a hundred smiley faces on one slide, or even a hundred stars on a dark blue slide.
To learn more, choose your version of PowerPoint. If we do not have a tutorial for your version of PowerPoint, explore the version closest to the one you use.
Filed Under:
D
Tagged as: 06-04, Duplicating Shapes and Drawing Multiple Shapes, Shapes, Tutorials
Comments Off on Duplicating Shapes, and Drawing Multiple Shapes: Drawing Multiple Shapes Quickly in PowerPoint

Kyle Murtagh is a public speaker. In 2018, he founded Confidence by Design, an industry-leading presentation skills company that has helped people from all walks of life to transform their public speaking abilities – from global corporations to ambitious entrepreneurs.
His passion, hard work, and talent have also led him to win multiple public speaking accolades, both in Scotland and on an international level. Not only that, but Kyle is now a successful author! His debut title, The 5 Pillars of Effective Public Speaking has received 5-star reviews from readers across the globe, who have discovered how to harness their public speaking potential to achieve tangible results.
Here’s a list of links on Indezine sites, where he has been featured:
 How to Make Your Feedback Inspiring
June 2, 2021
Filed Under:
K
Tagged as: Kyle Murtagh, Personality
Comments Off on Kyle Murtagh
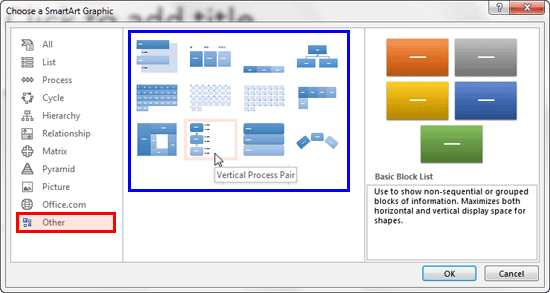
SmartArt in PowerPoint has replaced the diagram options in previous versions of PowerPoint. SmartArt also allows you to replace bullet points with info-graphic content using text-within-shapes that are more logical to view and present. There are different SmartArt categories available. Additionally, you can also add an additional SmartArt category that shows content from Office.com.
To learn more, choose your version of PowerPoint. If we do not have a tutorial for your version of PowerPoint, explore the version closest to the one you use.
Add Office.com SmartArt Graphics in PowerPoint 2010

Tutorial Code: 11 03 07
Previous: 11 03 06 Format SmartArt Graphics Text Attributess
Next: 11 03 08 Creating Timelines Using SmartArt
Filed Under:
A
Tagged as: 11-03, Advanced, PowerPoint Tutorials, SmartArt Graphics
Comments Off on Advanced SmartArt: Add Office.com SmartArt Graphics
After inserting a SmartArt graphic in PowerPoint, you can add animation to your SmartArt. You’ll discover that the entire graphic animates at the same time. It may seem that you have no control over animating individual SmartArt shapes, but that’s not entirely true since PowerPoint does provide some control over animating SmartArt shapes.
To learn more, choose your version of PowerPoint. If we do not have a tutorial for your version of PowerPoint, explore the version closest to the one you use.
Animate SmartArt in PowerPoint 2013
Animate SmartArt in PowerPoint 2010
Animate SmartArt in PowerPoint 2007
Animate SmartArt in PowerPoint 2011

Tutorial Code: 13 04 05
Previous: 13 04 04 Animate Text in PowerPoint
Next: 13 05 01 Trigger Animations in PowerPoint
Filed Under:
A
Tagged as: 13-04, Animate Slide Objects, Animations and Transitions, PowerPoint Tutorials
Comments Off on Animate Slide Objects: Animate SmartArt in PowerPoint
Microsoft and the Office logo are trademarks or registered trademarks of Microsoft Corporation in the United States and/or other countries.