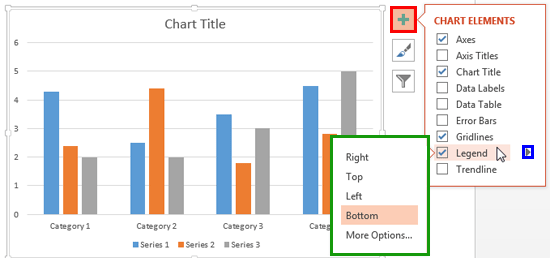
The legend within a chart is one of those elements that lets you identify all series in a chart via color or pattern. Typically, the legend is a box or area with those identifying color or pattern swatches.
To learn more, choose your version of PowerPoint. If we do not have a tutorial for your version of PowerPoint, explore the version closest to the one you use.
Microsoft Windows
Chart Legend in PowerPoint 2013
Chart Legend in PowerPoint 2010
Chart Legend in PowerPoint 2007
Chart Legend in PowerPoint 2003
Apple Mac
Chart Legend in PowerPoint 2011
Tutorial Code: 10 09 01
Previous: 10 08 08 Crossed Axes for Charts in PowerPoint
Next: 10 10 01 Picture Fills for Chart Series in PowerPoint