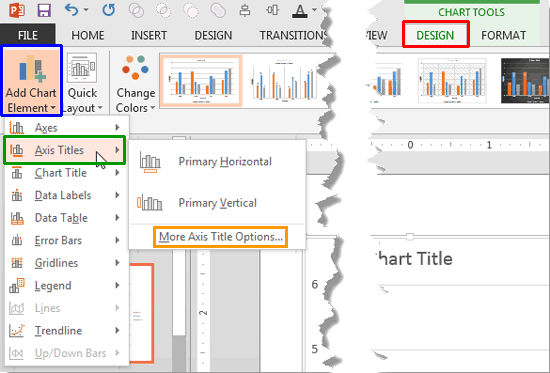
The text used to label chart axes in a chart is called an axis title. Most chart types with a few exceptions such as the pie and doughnut charts have axes. Although radar charts have an axis, there is no provision to add axis titles for them. In all other chart types such as column, line, etc., axis titles are not visible by default.
To learn more, choose your version of PowerPoint. If we do not have a tutorial for your version of PowerPoint, explore the version closest to the one you use.
Microsoft Windows
Axis Titles in PowerPoint 2013
Axis Titles in PowerPoint 2010
Apple Mac
Axis Titles in PowerPoint 2011
Tutorial Code: 10 08 02
Previous: 10 08 01 Axes in PowerPoint
Next: 10 08 03 Set Minimum and Maximum Values on Value Axis in PowerPoint