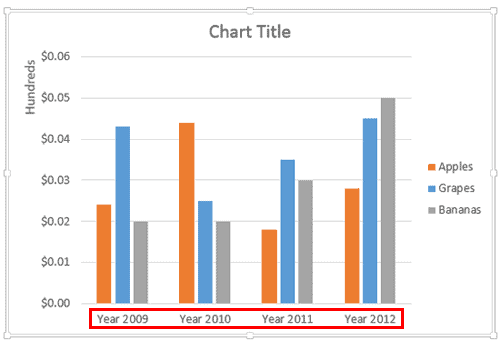
Axis labels, as the name suggests are labels for categories and values on your chart axes. Category names show as labels on the category axis. Similarly, values show as labels on the value axis. If you have a depth (series) axis in your chart, then series names show up as the labels on this axis.
To learn more, choose your version of PowerPoint. If we do not have a tutorial for your version of PowerPoint, explore the version closest to the one you use.
Microsoft Windows
Changing Axis Labels in PowerPoint 2013
Changing Axis Labels in PowerPoint 2010
Apple Mac
Changing Axis Labels in PowerPoint 2011
Tutorial Code: 10 08 06
Previous: 10 08 05 Change Major and Minor Units of Value Axis in PowerPoint
Next: 10 08 07 Reposition and Hide Axis Labels in PowerPoint
[…] Charts: Axis Labels, Changing […]