
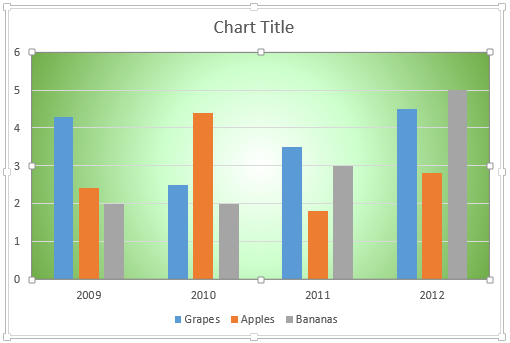
Gradient fills are typically blended fills between two or more colors that graduate from one color to another, and if you use neutral or muted colors, then a gradient fill can provide a great, understated backdrop for your chart.
To learn more, choose your version of PowerPoint. If we do not have a tutorial for your version of PowerPoint, explore the version closest to the one you use.
Microsoft Windows
Apply Gradient Fills to Plot Area of Charts in PowerPoint 2013
Apple Mac
Apply Gradient Fills to Plot Area of Charts in PowerPoint 2011
Tutorial Code: 10 03 04
Previous: 10 03 03 Apply Solid Fills to Plot Area of Charts in PowerPoint
Next: 10 03 05 Apply Picture Fills to Plot Area of Charts in PowerPoint