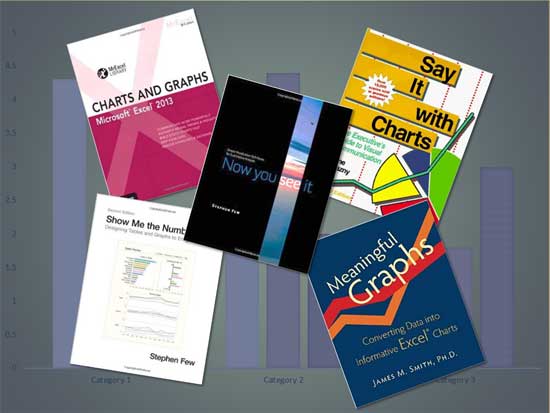
Most charting books fall into two categories. They are about charting design and charting techniques. Books within the first category look at charting, so as to how a particular chart will help people understand a difficult concept. They also look at design principles and best practices. Books within the second category look at the actual steps and techniques you need to explore to create those charts. There are a few books in this category that look at how charts can be created within Microsoft Excel, and almost no book is available similarly for PowerPoint, but that’s OK since Excel powers the charting engine within PowerPoint as well.
To learn more, click a link from the tutorials listed below.
All Versions
PowerPoint Chart Tips 10: Ask Help, Read Books
Tutorial Code: 10 15 11
Previous: 10 15 10 PowerPoint Chart Tips 09: Practice Often, or Hire a Professional
Next: 11 01 01 Inserting SmartArt in PowerPoint