![]()
This is the print version of this page. All content is copyright Indezine.com 2000-
2024.
![]()
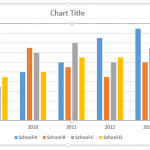
When you add a new chart in PowerPoint, you will see that it has its roots in Excel. All chart data is also stored within an Excel sheet. When you edit chart data within Excel, the process may not be limited just to changing the values. You may also need to add a new Series or Category. If we use a column chart as an example, Series within your Excel sheet show up as the columns. Categories on the other hand are essentially a set of series.
To learn more, choose your version of PowerPoint. If we do not have a tutorial for your version of PowerPoint, explore the version closest to the one you use.
Adding and Deleting Chart Series and Categories in PowerPoint 2013
Adding and Deleting Chart Series and Categories in PowerPoint 2011

Tutorial Code: 10 05 04
Previous: 10 05 03 Edit Chart Data in PowerPoint
Next: 10 05 05 Hiding Chart Series and Categories in PowerPoint

Filed Under:
C
Tagged as: 10-05, Chart Data, Charts and Graphs, PowerPoint Tutorials
Comments Off on Chart Data: Adding and Deleting Chart Series and Categories in PowerPoint
Microsoft and the Office logo are trademarks or registered trademarks of Microsoft Corporation in the United States and/or other countries.